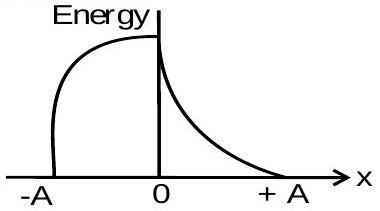
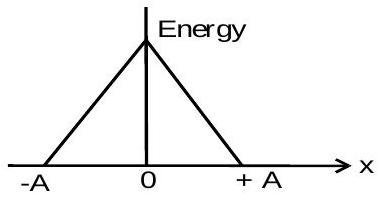
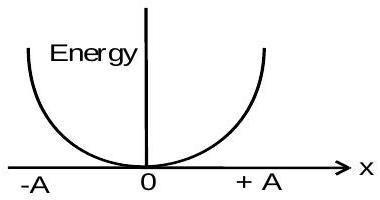
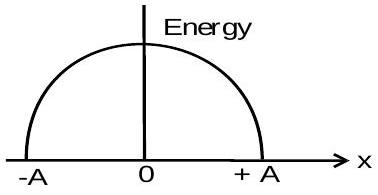
Which graph represents the difference between total energy and potential energy of a particle executing SHM Vs it's distance from mean position?
(A)(see structure)
(B)(see structure)
(C)(see structure)
(D)(see structure)✓ Correct
Answer: (D)
Solution
The difference asked for is total energy minus potential energy, which is the kinetic energy of the oscillator:
E−U=21mω2(A2−x2).
As a function of displacement this is a downward curve: it reaches its maximum at the mean position x=0 and falls to zero at the extreme positions x=±A. The graph that rises to a single peak at the centre and meets the axis at ±A represents this relation.
JEE Main · 2023 · 13 Apr 2023 · Shift 1 · Single correct option