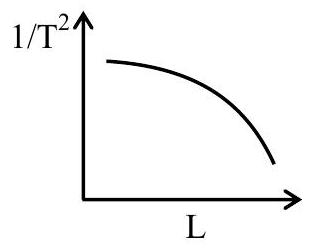
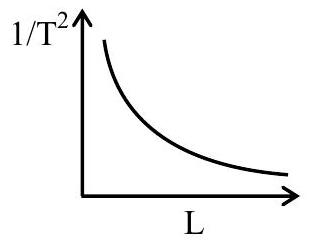
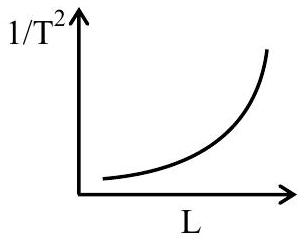
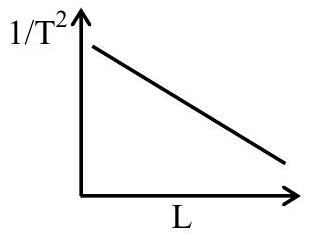
Using a simple pendulum experiment g is determined by measuring its time period T. Which of the following plots represent the correct relation between the pendulum length L and time period T?
(A)(see structure)
(B)(see structure)✓ Correct
(C)(see structure)
(D)(see structure)
Answer: (B)
Solution
From T=2πgL, T2=g4π2L, so
T21=4π2g⋅L1.
Hence T21 is inversely proportional to L, and a graph of T21 against L is a rectangular hyperbola that falls steeply for small L and flattens towards the axis as L increases. The plot showing this decreasing hyperbola represents the correct relation.
JEE Main · 2026 · 22 Jan 2026 · Shift 2 · Single correct option