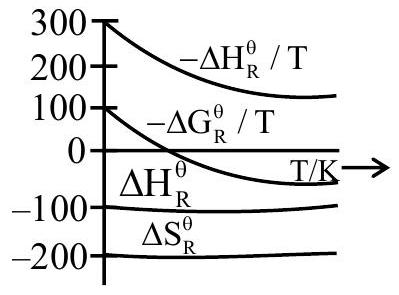
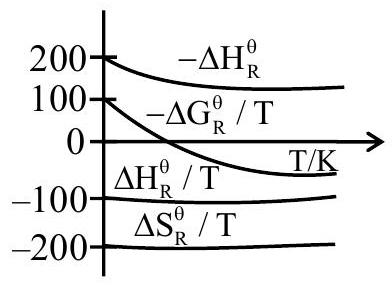
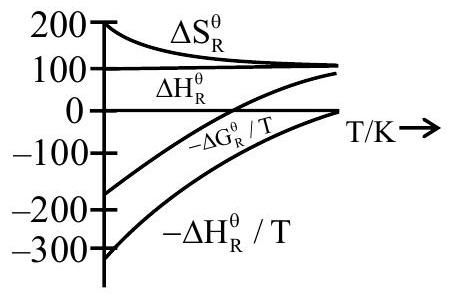
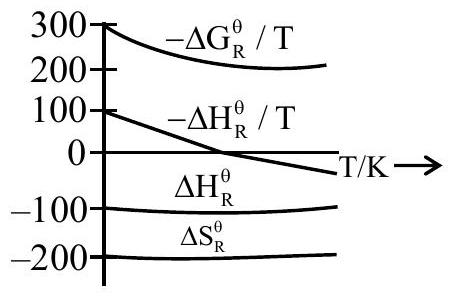
Which of the following graphs correctly represents the variation of thermodynamic properties of Haber's process?
(A)(see structure)✓ Correct
(B)(see structure)
(C)(see structure)
(D)(see structure)
Answer: (A)
Solution
Haber's synthesis NX2(g)+3HX2(g)2NHX3(g) is exothermic, so ΔHR∘ is negative, and it proceeds with a decrease in the number of gaseous moles, so ΔSR∘ is negative; both are essentially independent of temperature and appear as constant lines below the axis. Since ΔHR∘<0, the quantity −ΔHR∘/T is positive and falls towards zero as T increases. From −ΔGR∘/T=RlnK=−ΔHR∘/T+ΔSR∘, the curve for −ΔGR∘/T lies below −ΔHR∘/T by the constant ∣ΔSR∘∣ and also decreases with temperature, crossing zero as K drops below unity. The correct graph is the one showing ΔHR∘ and ΔSR∘ as constant negative lines, −ΔHR∘/T positive and decreasing, and −ΔGR∘/T decreasing beneath it.
JEE Main · 2025 · 02 Apr 2025 · Shift 2 · Single correct option