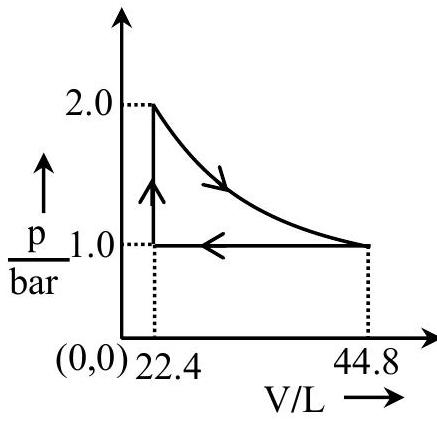
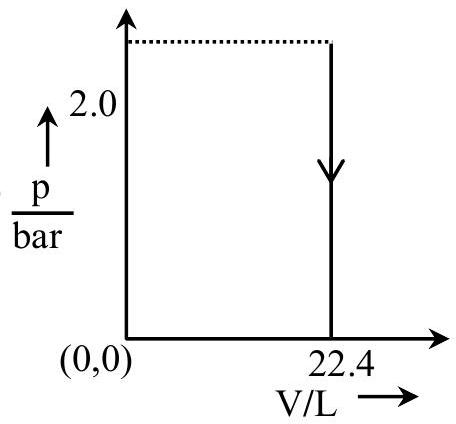
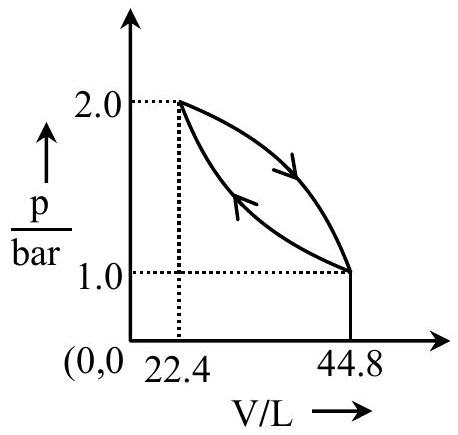
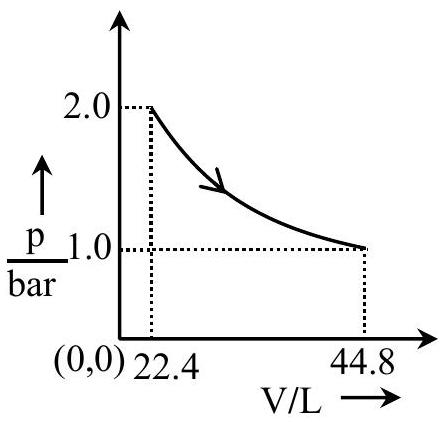
Which of the following graphs between pressure 'P' versus volume 'V' represent the maximum work done?
(A)(see structure)
(B)(see structure)
(C)(see structure)
(D)(see structure)✓ Correct
Answer: (D)
Solution
The work done by a gas equals the area under its pressure-volume curve during expansion. An isochoric change encloses no area and gives zero work, while a closed cyclic path returns the gas to a smaller volume, so its net work is only the area trapped inside the loop. The single expansion that runs from the high-pressure state down to the low-pressure state sweeps the entire area beneath the curve between the initial and final volumes, the largest of the four cases. That smooth expansion curve represents the maximum work done.
JEE Main · 2026 · 21 Jan 2026 · Shift 1 · Single correct option