JEE Advanced · 2010 · 11 Apr 2010 · Paper 2 · Chemical Thermodynamics

WhatsApp Email
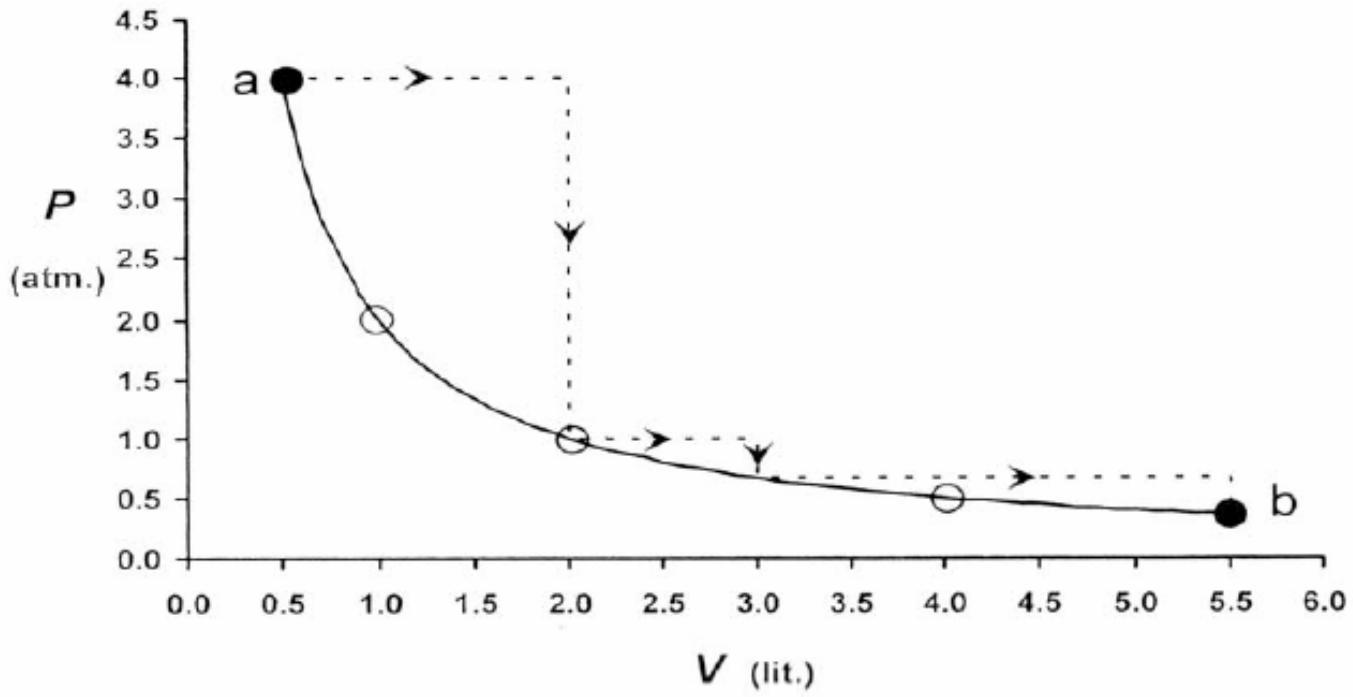
One mole of an ideal gas is taken from a to b along two paths denoted by the solid and the dashed lines as shown in the graph below. If the work done along the solid line path is and that along the dotted line path is , then the integer closest to the ratio is

Answer: 2

Solution

Work done by a gas is the area under the P-V curve. The dashed path (curved) represents a process at higher pressure for most of the volume change compared to the solid path (straight line). Therefore, the area under the dashed curve is approximately twice the area under the solid line. The ratio wₐ/wₛ ≈ 2.
JEE Advanced · 2010 · 11 Apr 2010 · Paper 2 · Integer answer

More JEE Advanced questions on Chemical Thermodynamics

  1. An ideal gas (0.5 mol), initially at 2 bar pressure, is compressed at a constant temperature of 600 K in two steps : first against a constant external pressure of P bar , and then against constant external pressure of 8 bar. At each step, the compression is st …
    JEE Advanced 2026View solution →
  2. List-I contains various physical/chemical processes, and List-II contains combinations of changes in enthalpy and entropy . Match each entry in List-I to appropriate entry in List-II, and choose the correct option.

    | List-I | | List …
    JEE Advanced 2026View solution →
  3. Considering ideal gas behavior, the expansion work done (in kJ) when 144 g of water is electrolyzed completely under constant pressure at 300 K is ____.

    Use: Universal gas constant ; Atomic mass (in amu): …
    JEE Advanced 2025View solution →
  4. Consider the following volume-temperature (V - T) diagram for the expansion of 5 moles of an ideal monoatomic gas.

    (see diagram)

    Considering only P-V work is involved, the total change in enthalpy (in Joule) for the transformation of state in the sequence …
    JEE Advanced 2024View solution →
  5. The entropy versus temperature plot for phases and at 1 bar pressure is given.
    and are entropies of the phases at temperatures T and 0 K, respectively.

    (see diagram)

    The transition temperature for to …
    JEE Advanced 2023View solution →
  6. The entropy versus temperature plot for phases and at 1 bar pressure is given.
    and are entropies of the phases at temperatures T and 0 K, respectively.

    (see diagram)

    The transition temperature for to …
    JEE Advanced 2023View solution →