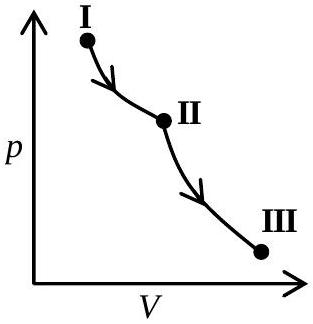
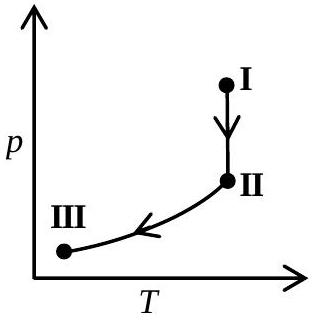
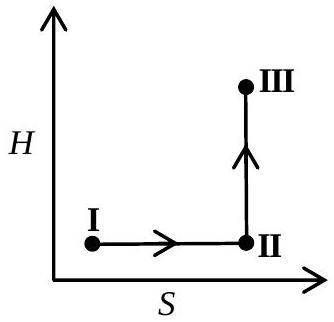
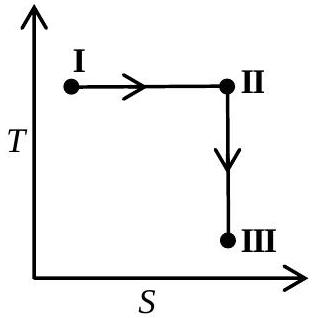
An ideal gas undergoes a reversible isothermal expansion from state I to state II followed by a reversible adiabatic expansion from state II to state III. The correct plot(s) representing the changes from state I to state III is(are) (p: pressure, V: volume, T: temperature, H: enthalpy, S: entropy)
(A)(see structure)✓ Correct
(B)(see structure)✓ Correct
(C)(see structure)
(D)(see structure)✓ Correct
Answer: (A), (B), (D)
Solution
State I → II (Reversible isothermal expansion):
T constant, so H constant (for ideal gas, H depends only on T)
V increases, p decreases
S increases (entropy increases in isothermal expansion)
State II → III (Reversible adiabatic expansion):
V increases, p decreases, T decreases
H decreases (since T decreases)
S constant (adiabatic reversible process has ΔS = 0)
Analysis of options:
(A) Shows p vs V: correct - both processes show p decreasing as V increases
(B) Shows S vs T: correct - S increases at constant T (I→II), then S constant as T decreases (II→III)
(C) Shows H vs T: INCORRECT - shows H increasing from II to III, but H should decrease as T decreases
(D) Shows H vs S: correct - H constant as S increases (I→II), then H decreases at constant S (II→III)
JEE Advanced · 2021 · 03 Oct 2021 · Paper 1 · One or more correct options