JEE Advanced · 2021 · 03 Oct 2021 · Paper 1 · Chemical Thermodynamics

WhatsApp Email
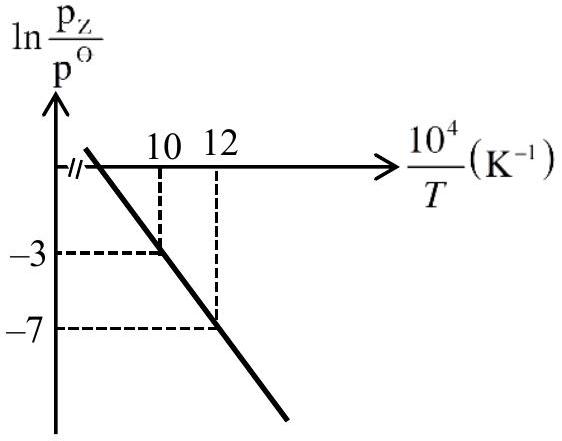
For the reaction , the plot of versus is given below (in solid line), where is the pressure (in bar) of the gas at temperature and bar.

(Given, , where the equilibrium constant, and the gas constant, )

The value of (in ) for the given reaction, at 1000 K is ____.

Answer: 141.33

Solution

From the previous question, kJ/mol = 166280 J/mol

From the graph, when , we have K and

Using:


J K⁻¹ mol⁻¹

JEE Advanced · 2021 · 03 Oct 2021 · Paper 1 · Numerical answer
More JEE Advanced questions on Chemical Thermodynamics

  1. An ideal gas (0.5 mol), initially at 2 bar pressure, is compressed at a constant temperature of 600 K in two steps : first against a constant external pressure of P bar , and then against constant external pressure of 8 bar. At each step, the compression is st …
    JEE Advanced 2026View solution →
  2. List-I contains various physical/chemical processes, and List-II contains combinations of changes in enthalpy and entropy . Match each entry in List-I to appropriate entry in List-II, and choose the correct option.

    | List-I | | List …
    JEE Advanced 2026View solution →
  3. Considering ideal gas behavior, the expansion work done (in kJ) when 144 g of water is electrolyzed completely under constant pressure at 300 K is ____.

    Use: Universal gas constant ; Atomic mass (in amu): …
    JEE Advanced 2025View solution →
  4. Consider the following volume-temperature (V - T) diagram for the expansion of 5 moles of an ideal monoatomic gas.

    (see diagram)

    Considering only P-V work is involved, the total change in enthalpy (in Joule) for the transformation of state in the sequence …
    JEE Advanced 2024View solution →
  5. The entropy versus temperature plot for phases and at 1 bar pressure is given.
    and are entropies of the phases at temperatures T and 0 K, respectively.

    (see diagram)

    The transition temperature for to …
    JEE Advanced 2023View solution →
  6. The entropy versus temperature plot for phases and at 1 bar pressure is given.
    and are entropies of the phases at temperatures T and 0 K, respectively.

    (see diagram)

    The transition temperature for to …
    JEE Advanced 2023View solution →