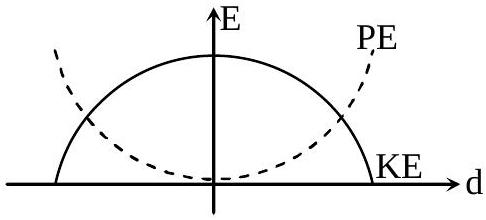
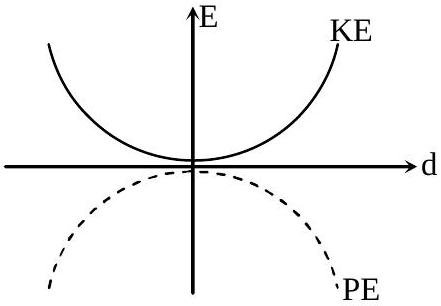
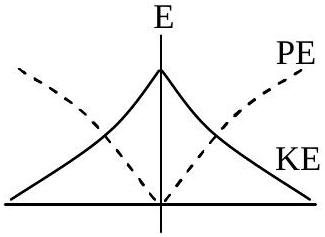
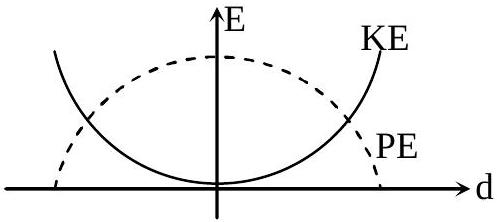
For a simple pendulum, a graph is plotted between its kinetic energy (KE) and potential energy (PE) against its displacement d. Which one of the following represents these correctly? (Graphs are schematic and not drawn to scale)
(A)(see structure)✓ Correct
(B)(see structure)
(C)(see structure)
(D)(see structure)
Answer: (A)
Solution
Energy in a pendulum trades cleanly between its two forms. Measuring displacement d from the mean position, the potential energy climbs as PE∝d2 -- zero at the centre, greatest at the extremes -- so its graph is an upright parabola. The kinetic energy is whatever is left of the fixed total, KE=E−PE, so it peaks at the centre and falls to zero at the turning points, tracing a downward-opening parabola. The correct picture is the pair in which the KE curve is highest at d=0 exactly where the PE curve bottoms out.
JEE Main · 2015 · 04 Apr 2015 · Offline · Single correct option