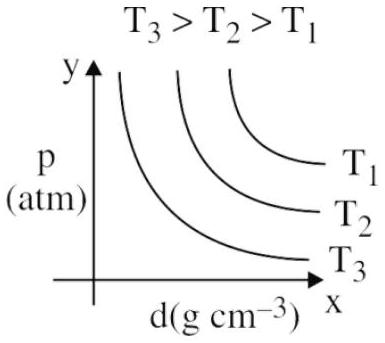
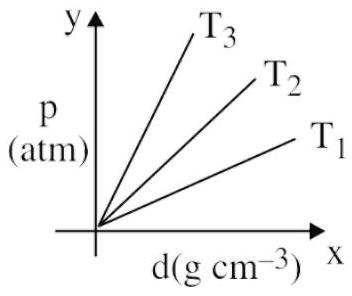
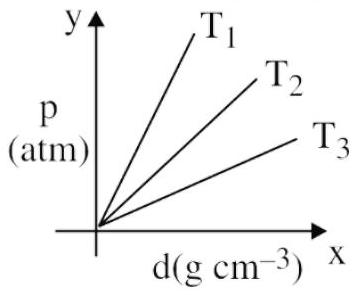
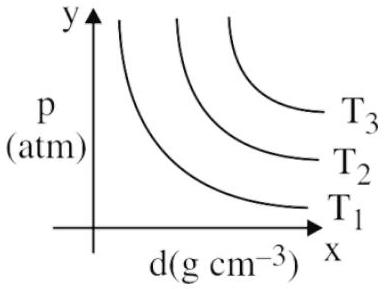
Which amongst the given plots is the correct plot for pressure (p) vs density (d) for an ideal gas ?
(A)(see structure)
(B)T3>T2>T1 (see structure)✓ Correct
(C)T3>T2>T1 (see structure)
(D)T3>T2>T1 (see structure)
Answer: (B)
Solution
For an ideal gas, the ideal gas equation is PV=nRT. Rearranging in terms of density d=Vm=VnM, we get P=MRTd. This shows that pressure is directly proportional to density at constant temperature, with slope MRT. Since the slope increases with temperature, higher temperature lines have steeper slopes. The correct plot shows straight lines passing through the origin with increasing slopes for T3>T2>T1.
JEE Main · 2022 · 27 Jun 2022 · Shift 2 · Single correct option