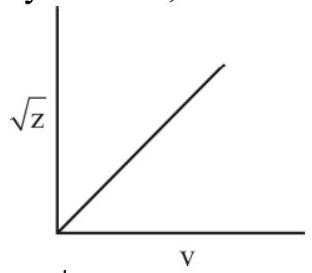
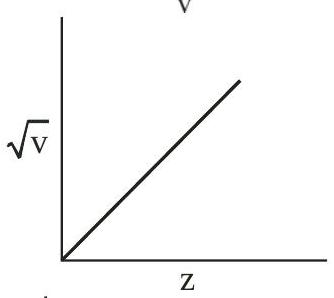
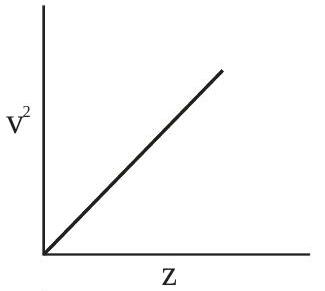
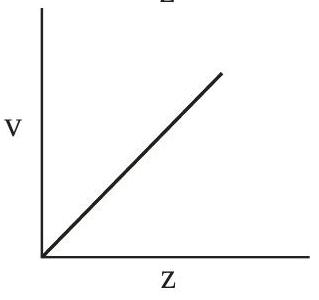
Henry Moseley studied characteristic X-ray spectra of elements. The graph which represents his observation correctly is : (Given v= frequency of X -ray emitted; Z= atomic number)
(A)(see structure)
(B)(see structure)✓ Correct
(C)(see structure)
(D)(see structure)
Answer: (B)
Solution
Moseley found that the square root of the frequency of the characteristic X-rays emitted by an element is directly proportional to its atomic number, following ν=a(Z−b). A plot of the square root of the frequency against the atomic number is therefore a straight line. The graph with the square root of the frequency on the vertical axis rising linearly with the atomic number on the horizontal axis correctly represents this observation.
JEE Main · 2023 · 08 Apr 2023 · Shift 2 · Single correct option