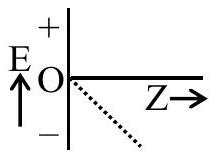
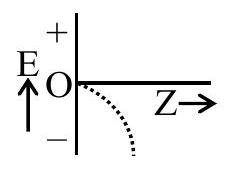
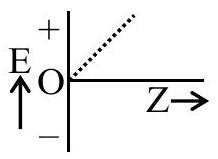
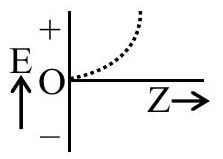
For hydrogen like species, which of the following graphs provides the most appropriate representation of E vs Z plot for a constant n ? [E: Energy of the stationary state, Z : atomic number, n= principal quantum number]
(A)(see structure)
(B)(see structure)✓ Correct
(C)(see structure)
(D)(see structure)
Answer: (B)
Solution
For a hydrogen-like species, En=−n213.6Z2 eV. At fixed n, this reduces to E=−kZ2 with k=13.6/n2>0, a downward-opening parabola in Z that passes through the origin at Z=0 and becomes increasingly negative as Z increases. The graph must start at E=0 for Z=0 and curve smoothly downward into negative E, with the magnitude of the slope growing as Z grows — the shape traced in option B.
JEE Main · 2025 · 29 Jan 2025 · Shift 2 · Single correct option