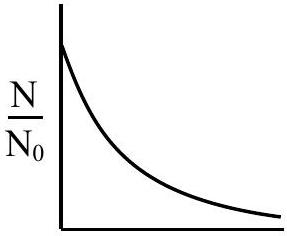
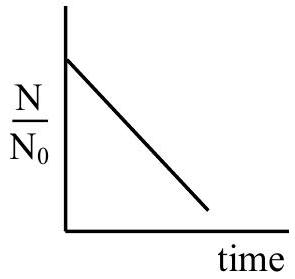
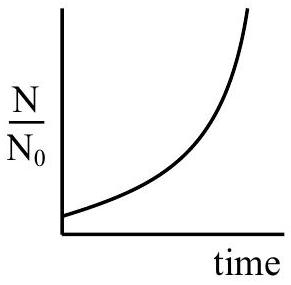
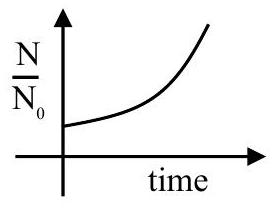
For bacterial growth in a cell culture, growth law is very similar to the law of radioactive decay. Which of the following graphs is most suitable to represent bacterial colony growth?
(A)(see graph)
(B)(see graph)
(C)(see graph)
(D)(see graph)✓ Correct
Answer: (D)
Solution
Bacterial growth in a culture follows first-order growth kinetics, the mirror image of radioactive decay. Radioactive decay obeys N=N0e−λt, a curve that falls steeply at first and flattens as it approaches zero. Bacterial growth simply flips the sign of the exponent, N=N0eKt with K>0. This function starts at N0 (never at zero, since a culture always begins with a starting population) and its slope keeps increasing with time, curving upward more and more steeply rather than levelling off. The graph that rises from N0 with an increasing, concave-up (accelerating) shape represents this exponential growth.
JEE Main · 2025 · 28 Jan 2025 · Shift 2 · Single correct option