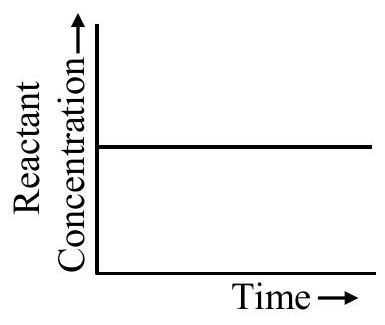
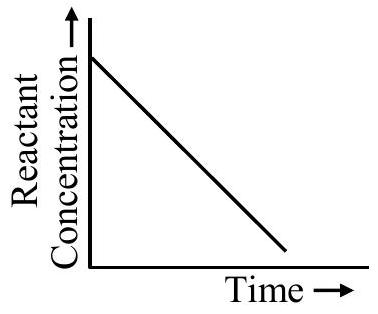
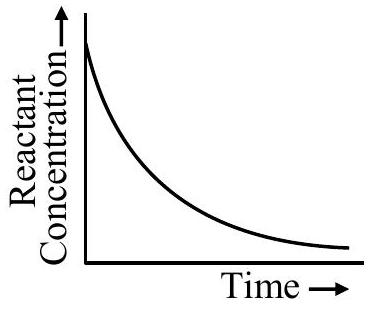
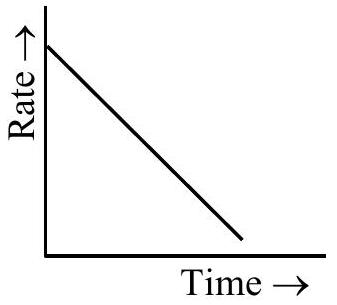
Which of the following graphs most appropriately represents a zero order reaction?
(A)(see structure)
(B)(see structure)✓ Correct
(C)(see structure)
(D)(see structure)
Answer: (B)
Solution
For a zero order reaction, the rate is independent of concentration, so integrating rate =k gives [A]=[A]0−kt: concentration falls linearly with time, with a constant negative slope of magnitude k, reaching zero at a finite time and staying there. The graph showing reactant concentration decreasing linearly with time represents this behaviour.
JEE Main · 2025 · 23 Jan 2025 · Shift 2 · Single correct option