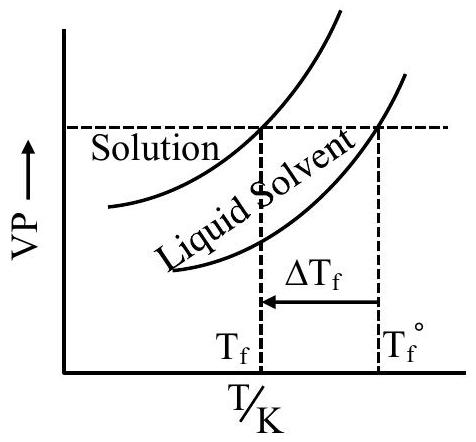
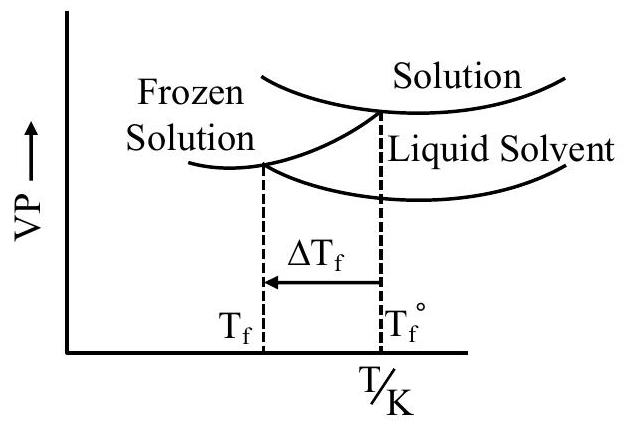
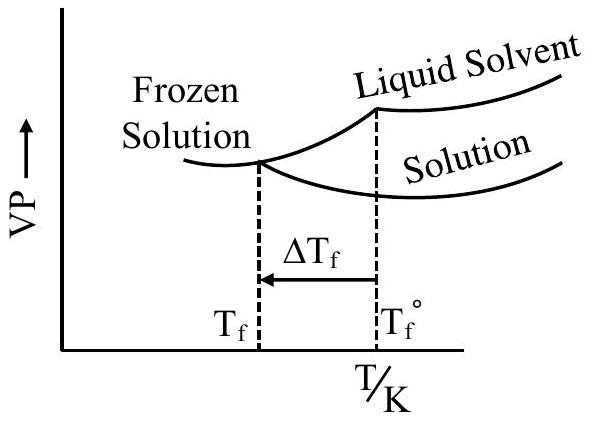
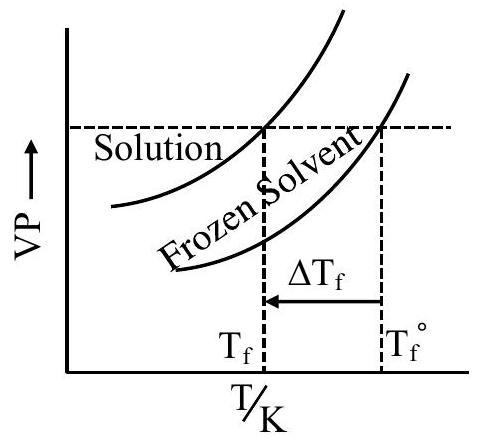
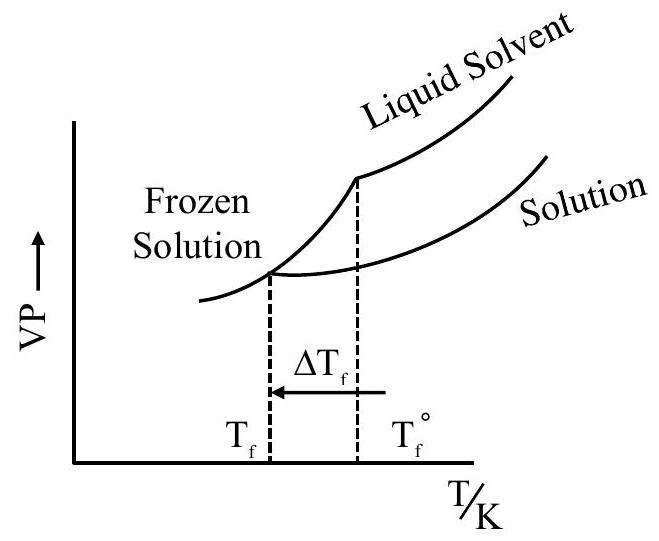
Consider the given plots of vapour pressure (VP) vs temperature (T/K) Which amongst the following options is correct graphical representation showing ΔTf, depression in the freezing point of solvent in a solution?
(A)(see structure)
(B)(see structure)
(C)(see structure)✓ Correct
(D)(see structure)
Answer: (C)
Solution
Adding a non-volatile solute lowers a solvent's vapour pressure at every temperature (Raoult's law), so the solution's vapour-pressure curve lies below the pure liquid solvent's curve throughout.
The freezing point of a phase is where its liquid vapour-pressure curve meets the vapour-pressure curve of the frozen (solid) phase. Because the solution curve sits lower than the pure-solvent curve, it crosses the frozen-solid curve at a lower temperature than the pure liquid solvent does: Tf<Tf∘.
The correct graph shows a single frozen-solid curve, the pure liquid-solvent curve crossing it at the higher temperature Tf∘, and the solution curve crossing the same frozen-solid curve at the lower temperature Tf, with ΔTf=Tf∘−Tf marked as the gap between these two crossing points.
JEE Main · 2025 · 24 Jan 2025 · Shift 1 · Single correct option