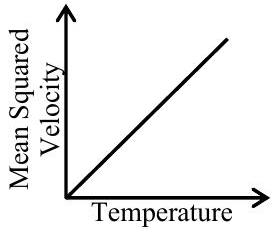
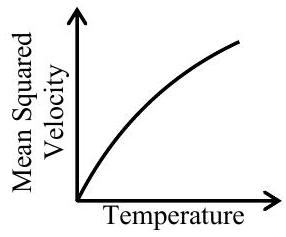
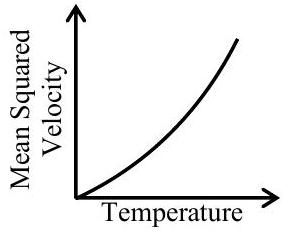
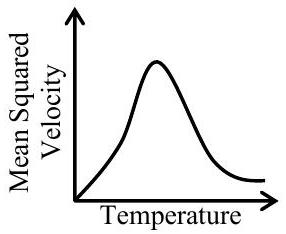
For a particular ideal gas which of the following graphs represents the variation of mean squared velocity of the gas molecules with temperature?(A)b1fdb5fb-0abb-467f-8144-df778c21c8e7-04_234_278_386_312.jpg✓ Correct(B)b1fdb5fb-0abb-467f-8144-df778c21c8e7-04_237_286_383_708.jpg(C)b1fdb5fb-0abb-467f-8144-df778c21c8e7-04_236_289_635_310.jpg(D)b1fdb5fb-0abb-467f-8144-df778c21c8e7-04_234_286_632_708.jpgAnswer: (A)SolutionThe root-mean-square speed of an ideal gas isvrms=M3RT⟹vrms2=M3RTFor a particular gas, the molar mass M is fixed, so vrms2 is directly proportional to the absolute temperature T — this is a straight line through the origin with a positive slope.JEE Main · 2025 · 28 Jan 2025 · Shift 1 · Single correct option