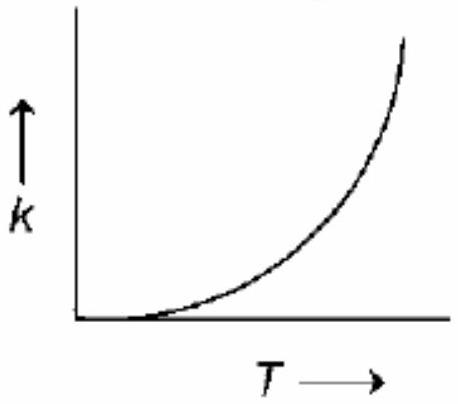
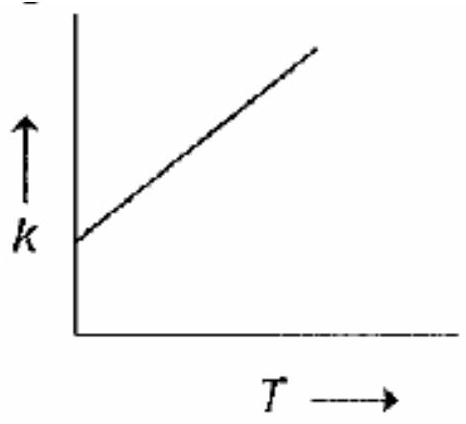
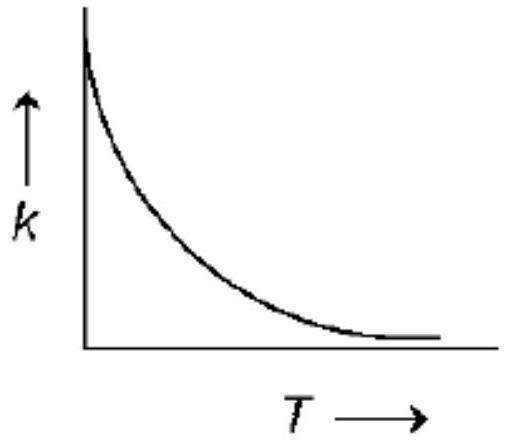
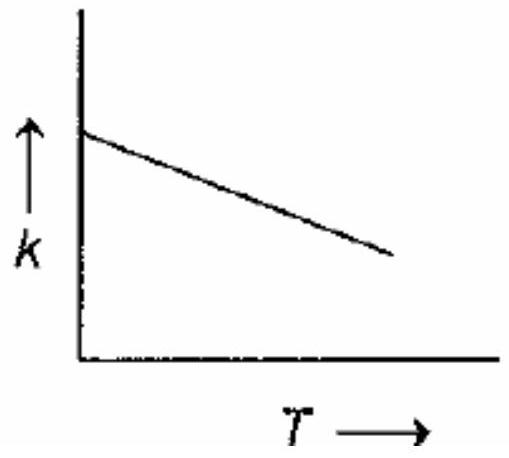
Plots showing the variation of the rate constant (k) with temperature (T) are given below. The plot that follows Arrhenius equation is
(A)(see structure)✓ Correct
(B)(see structure)
(C)(see structure)
(D)(see structure)
Answer: (A)
Solution
The Arrhenius equation is k=Ae−Ea/RT, which in logarithmic form becomes lnk=lnA−REa⋅T1. This shows that a plot of ln k versus 1/T should be linear with a negative slope. Option A shows this characteristic linear relationship with negative slope, which is the correct representation of the Arrhenius equation.
JEE Advanced · 2010 · 11 Apr 2010 · Paper 1 · Single correct option