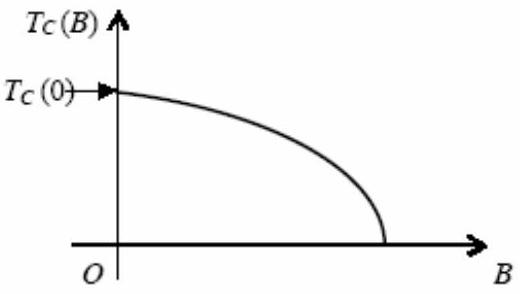
Electrical resistance of certain materials, known as superconductors, changes abruptly from a nonzero value to zero as their temperature is lowered below a critical temperature Tc(0). An interesting property of superconductors is that their critical temperature becomes smaller than Tc(0) if they are placed in a magnetic field, i.e., the critical temperature Tc(B) is a function of the magnetic field strength B. The dependence of Tc(B) on B is shown in the figure.
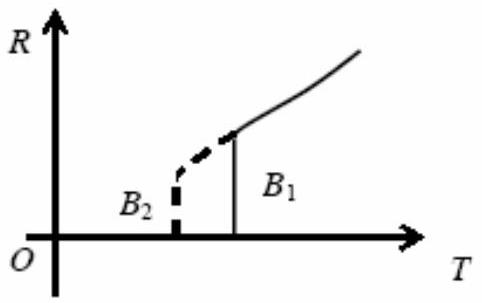
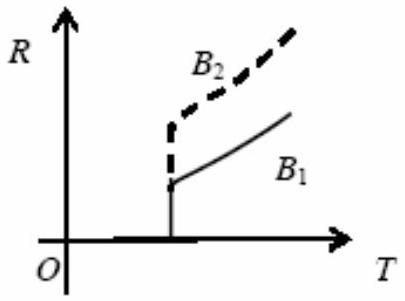
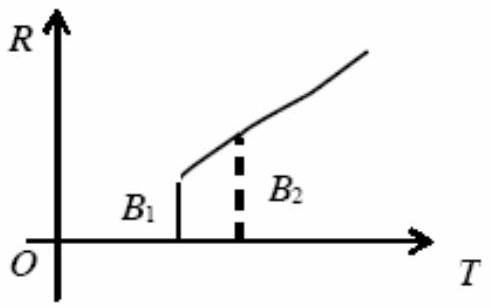
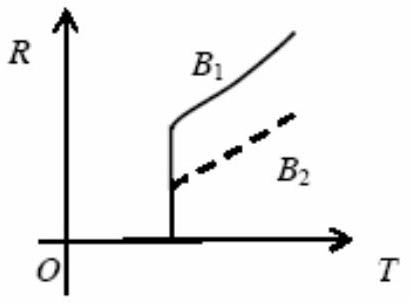
In the graphs below, the resistance R of a superconductor is shown as a function of its temperature T for two different magnetic fields B1 (solid line) and B2 (dashed line). If B2 is larger than B1, which of the following graphs shows the correct variation of R with T in these fields?
(A)(see structure)✓ Correct
(B)(see structure)
(C)(see structure)
(D)(see structure)
Answer: (A)
Solution
From the given information, as magnetic field B increases, the critical temperature Tc(B) decreases.
For B2>B1: Tc(B2)<Tc(B1).
The resistance drops to zero at the critical temperature. Therefore:
The solid line (B1) should show R dropping to zero at a higher temperature.
The dashed line (B2) should show R dropping to zero at a lower temperature.
Option A correctly shows this behavior: the dashed line (higher field B2) has its transition to zero resistance at a lower temperature than the solid line (B1).
JEE Advanced · 2010 · 11 Apr 2010 · Paper 1 · Single correct option