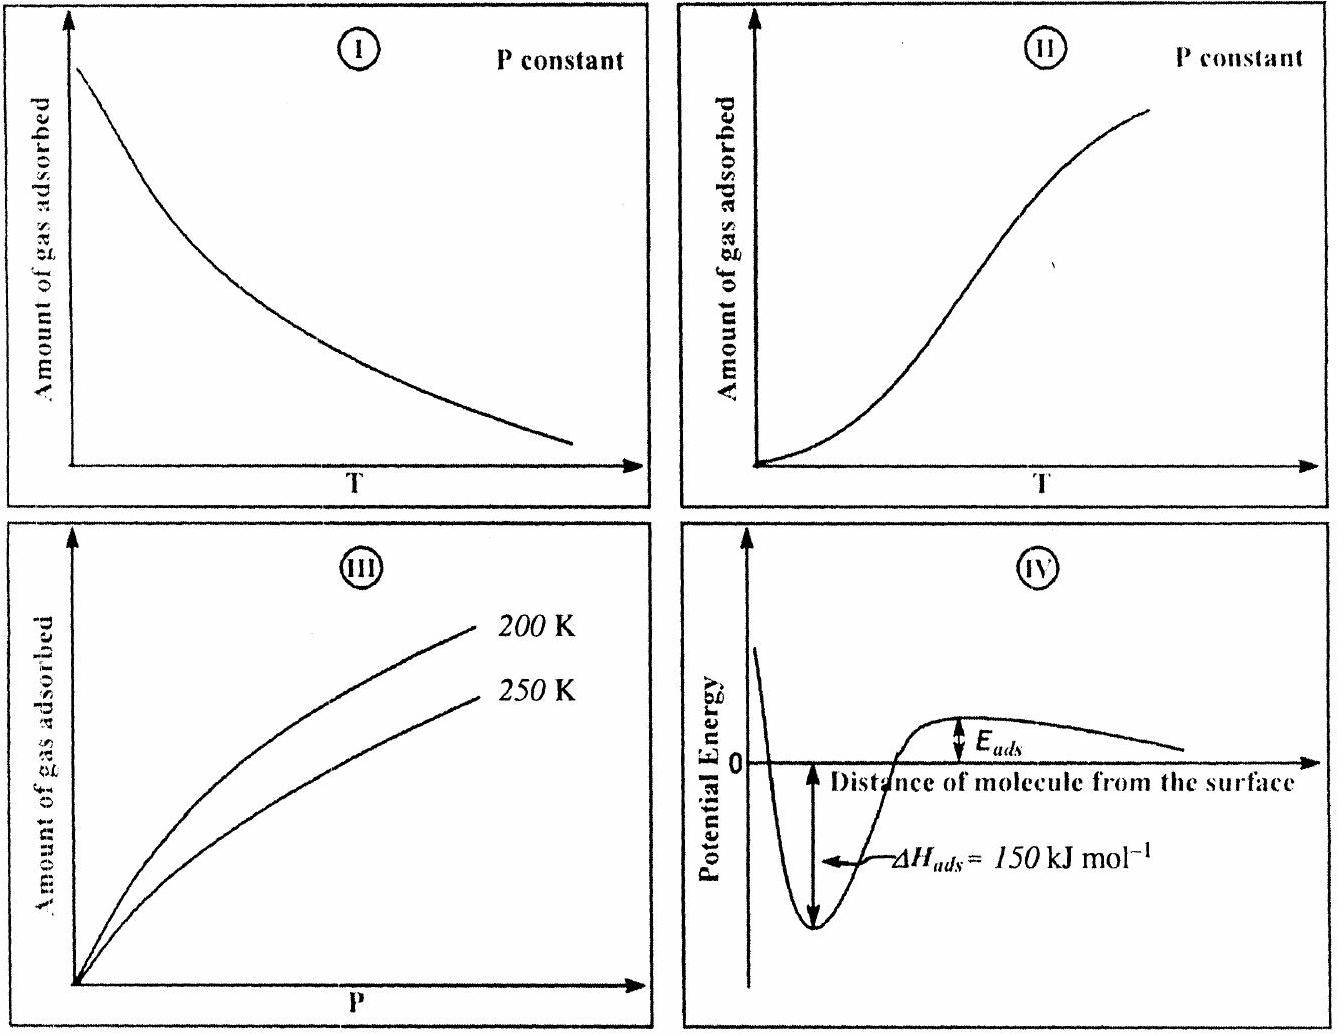
The given graphs / data I, II, III and IV represent general trends observed for different physisorption and chemisorption processes under mild conditions of temperature and pressure. Which of the following choice(s) about I, II, III and IV is (are) correct?
(A)I is physisorption and II is chemisorption✓ Correct
(B)I is physisorption and III is chemisorption
(C)IV is chemisorption and II is chemisorption✓ Correct
(D)IV is chemisorption and III is chemisorption
Answer: (A), (C)
Solution
Physisorption decreases with increasing temperature (exothermic, weak van der Waals forces), while chemisorption initially increases with temperature (requires activation energy). Graph I shows adsorption decreasing with temperature (physisorption). Graph II shows adsorption increasing with temperature (chemisorption). Graph III shows adsorption increasing with pressure (physisorption). Graph IV shows bond formation (chemisorption). Therefore, (A) and (C) are correct.
JEE Advanced · 2012 · 08 Apr 2012 · Paper 2 · One or more correct options