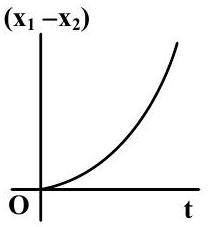
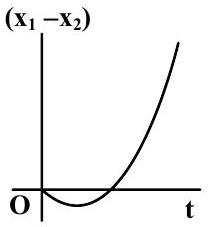
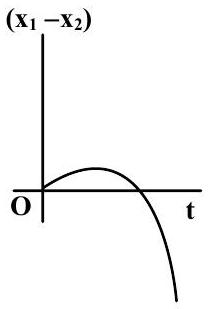
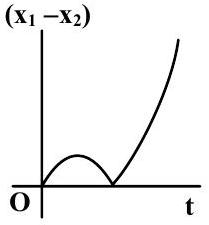
A body is at rest at x=0. At t=0, it starts moving in the positive x-direction with a constant acceleration. At the same instant another body passes through x=0 moving in the positive x direction with a constant speed. The position of the first body is given by x1(t) after time 't' and that of the second body by x2(t) after the same time interval. Which of the following graphs correctly describes (x1−x2) as a function of time 't'?
(A)(see graph)
(B)(see graph)✓ Correct
(C)(see graph)
(D)(see graph)
Answer: (B)
Solution
The body starting from rest with constant acceleration moves as x1=21at2, while the one moving at constant speed covers x2=vt. Their separation is x1−x2=21at2−vt, a parabola in t opening upward and passing through the origin. For small times the linear −vt term dominates, so the difference dips negative; as time grows the quadratic term takes over and the difference climbs back through zero and becomes large and positive. The graph that starts at the origin, dips below the axis and then rises is the correct description.
JEE Main · 2008 · 27 Apr 2008 · Offline · Single correct option