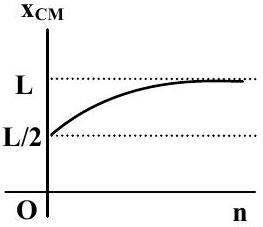
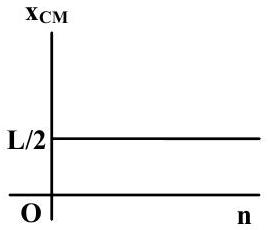
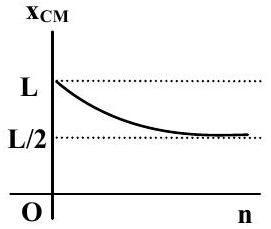
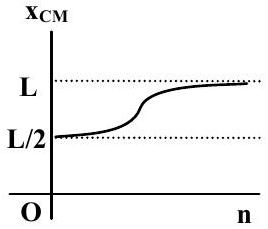
A thin rod of length 'L' is lying along the x-axis with its ends at x=0 and x=L. Its linear density (mass/length) varies with x as k(Lx)n, where n can be zero or any positive number. If the position xCM of the centre of mass of the rod is plotted against 'n', which of the following graphs best approximates the dependence of xCM on n?
(A)(see structure)✓ Correct
(B)(see structure)
(C)(see structure)
(D)(see structure)
Answer: (A)
Solution
The centre of mass is the mass-weighted mean position, xcm=∫0Lλdx∫0Lxλdx with λ=k(Lx)n. Both integrals are simple powers of x: the numerator yields a term in xn+2 and the denominator a term in xn+1, and after evaluating between 0 and L the constants and powers of L combine to xcm=n+2n+1L. At n=0 the rod is uniform and xcm=2L; as n grows the mass crowds towards the far end and xcm climbs through 32L,43L,…, rising steadily and levelling off towards L without ever reaching it. The curve that rises monotonically from 2L and saturates near L is the one that fits this dependence.
JEE Main · 2008 · 27 Apr 2008 · Offline · Single correct option