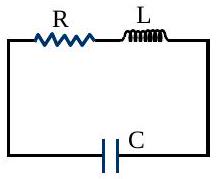
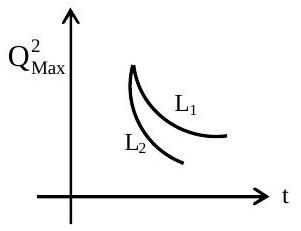
An LCR circuit is equivalent to a damped pendulum. In an LCR circuit the capacitor is charged to Q0 and then connected to the L and R as shown. If a student plots graphs of the square of maximum charge ( Qmax 2 ) on the capacitor with time ( t ) for two different values L1 and L2(L1>L2) of L then which of the following represents this graph correctly? (Plots are schematic and not drawn to scale)
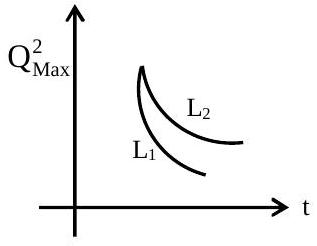
(A)(see figure)
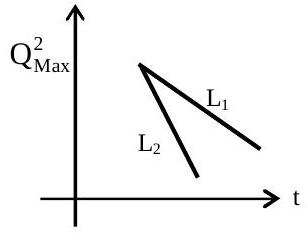
(B)(see figure)
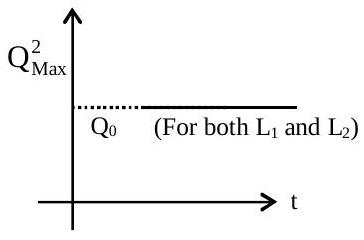
(C)(see figure)
(D)(see figure)✓ Correct
Answer: (D)
Solution
When the charged capacitor is connected across L and R, the charge oscillates inside a decaying envelope Qmax=Q0e−Rt/2L, so Qmax2=Q02e−Rt/L falls exponentially from Q02. The decay rate R/L is smaller for the larger inductance, so with L1>L2 the L1 curve loses its energy more slowly and stays above the L2 curve at every instant, both starting together at Q02. The correct plot is therefore the pair of exponentially decaying curves with L1 lying above L2.
JEE Main · 2015 · 04 Apr 2015 · Offline · Single correct option