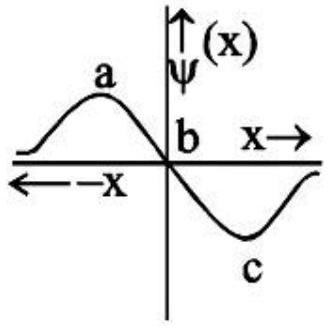
The sketch is a radial probability distribution, which peaks wherever an electron is most likely to be found and dips to zero at a radial node. The two humps, marked regions a and c, are the probability maxima, while region b between them is the node where the probability drops away. The electron is therefore most likely to be found in regions a and c.
JEE Main · 2019 · 12 Apr 2019 · Shift 1 · Single correct option