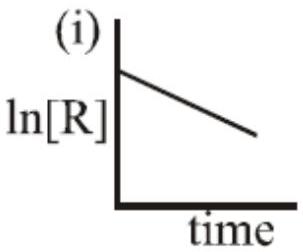
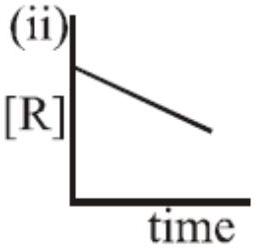
The given plots represent the variation of the concentration of a reactant R with time for two different reactions (i) and (ii). The respective orders of the reactions are:Plot (i)Plot (ii)
(A)1, 1
(B)0, 2
(C)0, 1✓ Correct
(D)1, 0
Answer: (C)
Solution
A zero-order reaction loses its reactant at a steady rate, so its concentration-against-time plot is a straight line. A first-order reaction loses it in proportion to how much is left, so its concentration falls off as a decaying exponential. The straight-line plot is thus zero order and the curved, exponential one is first order, giving orders 0 and 1.
JEE Main · 2019 · 09 Apr 2019 · Shift 1 · Single correct option