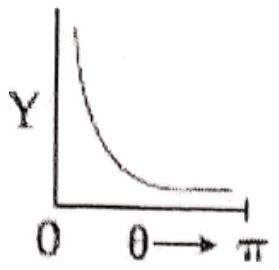
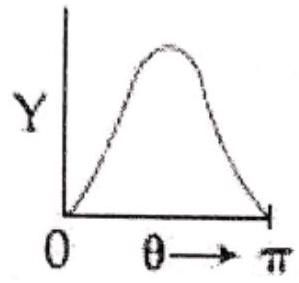
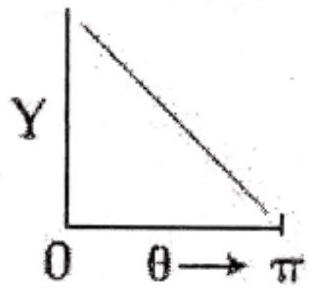
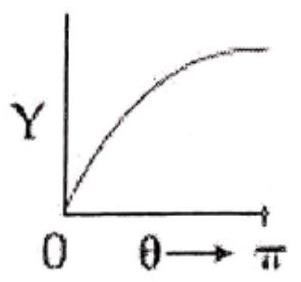
The graph which depicts the results of Rutherford gold foil experiment with α-particles is θ : Scattering angle Y : Number of scattered α-particles detected (Plots are schematic and not to scale)
(A)(see structure)✓ Correct
(B)(see structure)
(C)(see structure)
(D)(see structure)
Answer: (A)
Solution
In Rutherford's scattering experiment the number of α-particles detected at angle θ follows N∝1/sin4(θ/2). This makes N enormous for small deflections, falls off steeply as θ grows, and leaves only a tiny count near θ=180∘. The curve that matches is a sharp peak at small angles decaying rapidly as the angle increases, the hallmark of the sin−4(θ/2) dependence.
JEE Main · 2020 · 08 Jan 2020 · Shift 1 · Single correct option