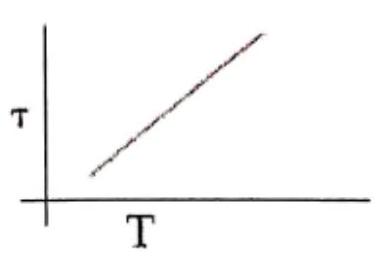
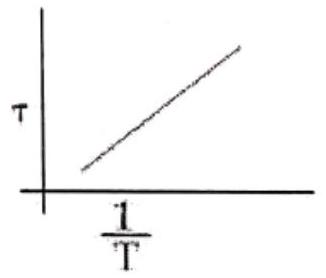
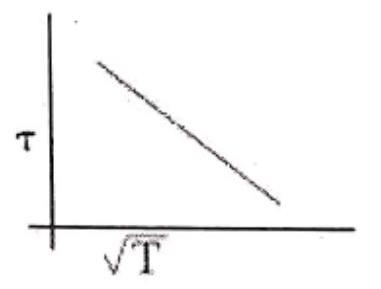
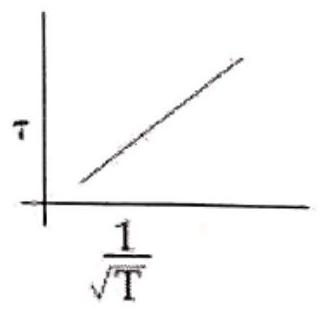
The plot that depicts the behavior of the mean free time τ (time between two successive collisions) for the molecules of an ideal gas, as a function of temperature (T), qualitatively, is: (Graphs are schematic and not drawn to scale)
(A)(see structure)
(B)(see structure)
(C)(see structure)
(D)(see structure)✓ Correct
Answer: (D)
Solution
The mean free time between collisions varies inversely with the average molecular speed, and that speed grows as T. Hence τ∝vavg1∝T1, a T−1/2 dependence in which τ is large at low temperature and falls off along a decaying curve as the temperature rises.
JEE Main · 2020 · 08 Jan 2020 · Shift 1 · Single correct option