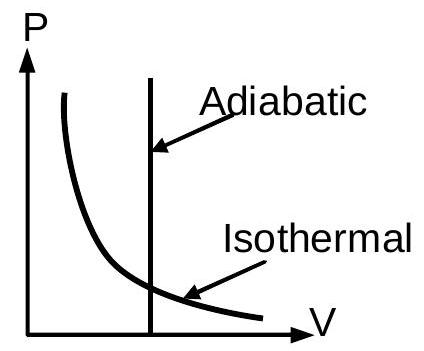
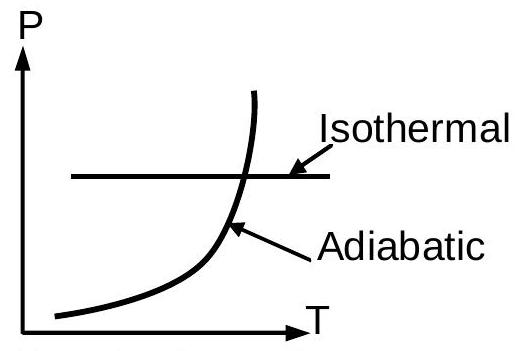
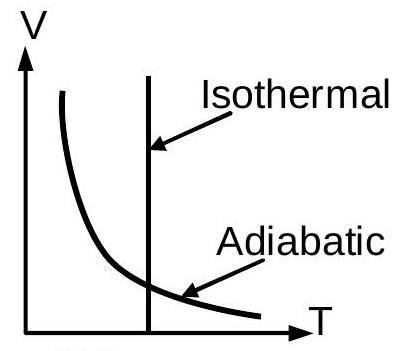
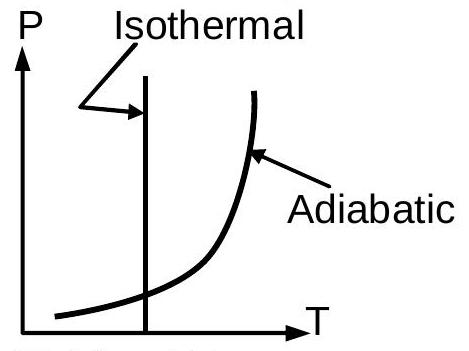
Which one is the correct option for the two different thermodynamic processes?abcd
(A)(c) and (a)
(B)(b) and (c)
(C)(c) and (d)✓ Correct
(D)(a) only
Answer: (C)
Solution
On any graph carrying T as an axis an isothermal change holds T fixed, so it must be the straight line perpendicular to the temperature axis. An adiabatic change of an ideal gas obeys TVγ−1= constant, so on a V–T plot the volume falls as the temperature rises along a curve, and it obeys P1−γTγ= constant, so on a P–T plot the pressure climbs steeply with temperature. In the P–V plot the vertical line is labelled adiabatic, but a vertical line there is a constant-volume change, and on a P–V plot both an isotherm and an adiabat are falling curves; that plot is wrong. In the first P–T plot the horizontal line is labelled isothermal, whereas an isotherm on a P–T plot is vertical; that plot is wrong too. The V–T plot with the vertical isotherm and the falling adiabat, and the P–T plot with the vertical isotherm and the rising adiabat, are drawn correctly: the diagrams labelled (c) and (d).
JEE Main · 2021 · 17 Mar 2021 · Shift 2 · Single correct option