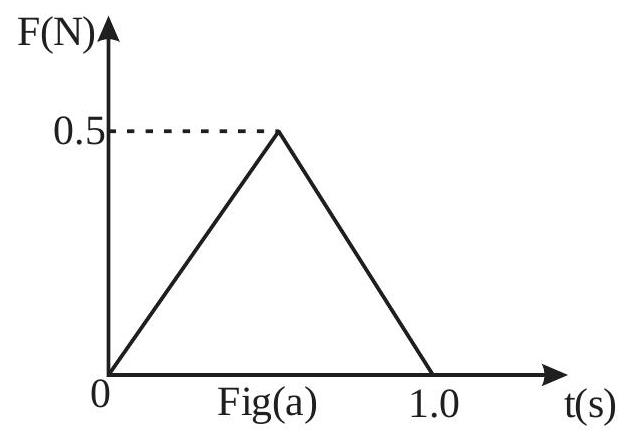
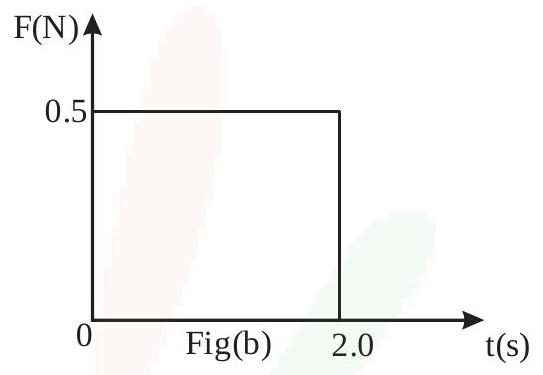
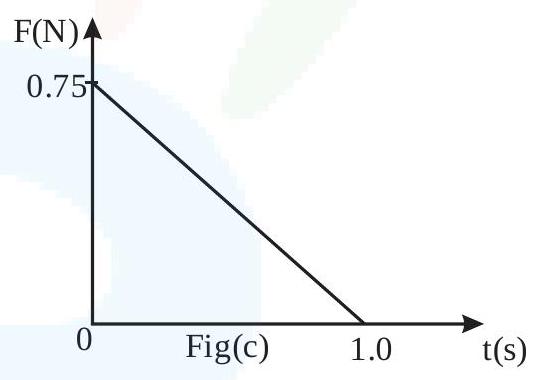
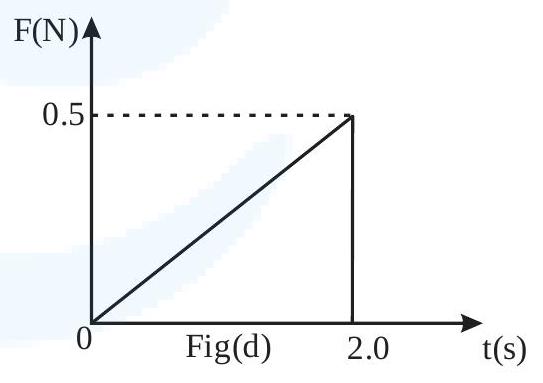
Figures (a), (b), (c) and (d) show variation of force with time.
The impulse is highest in figure.abcd
(A)Fig (c)
(B)Fig (b)✓ Correct
(C)Fig (a)
(D)Fig (d)
Answer: (B)
Solution
Impulse equals the area under the force-time graph. The triangle of (a) gives 21×1×0.5=0.25 N·s; the rectangle of (b) gives 0.5×2=1.0 N·s; the triangle of (c) gives 21×1×0.75=0.375 N·s; and the triangle of (d) gives 21×2×0.5=0.5 N·s. The largest of these areas belongs to figure (b), so the impulse is highest in figure (b).
JEE Main · 2023 · 01 Feb 2023 · Shift 2 · Single correct option